Validation of the Moral Foundations Questionnaire with three Chinese ethnic groups
Main Article Content
Moral foundations theory is claimed to be universally applicable and is classified into 5 foundations of morality: care/harm, fairness/cheating, loyalty/betrayal, respect/subversion, and purity/degradation. This theory has not been tested in the Eastern cultural context. Therefore, in this study I addressed this lack in the context of China, where there are people of a number of different ethnicities. I adopted the Moral Foundations Questionnaire, which was completed by 761 Chinese of Han, Uygur, and Tibetan ethnicity. The results show that there was no gender difference in morality foundation scores, but the differences among ethnic groups were significant: Tibetans scored lower than did Han and Uygur in care and fairness, and Uygur scored higher than Han and Tibetans did in loyalty, respect, and purity. The interactions between gender and ethnic group were significant for care, fairness, and respect. These findings suggest that moral foundations theory is applicable to China, that the Moral Foundations Questionnaire can also be partially applied to Chinese, and that ethnicity is an influential factor when people make moral judgments.
Kohlberg (1969) proposed that there are moral development stages, believing that moral development and cognitive development are synchronized, and that moral judgment is the result of reasoning. However, Haidt, Koller, and Dias (1993) disagreed with this assertion and, subsequently, Haidt (2001, 2012) proposed the moral foundations theory (MFT). These authors believe that moral judgment is the result of intuition and they offered a multifoundational model that brought a new research paradigm to the field of moral psychology (Graham et al., 2013; Graham, Haidt, & Nosek, 2009; Haidt, 2007; Haidt & Joseph, 2004). According to the MFT it is assumed that people make moral judgments mainly based on five different moral foundations: care/harm, fairness/cheating, loyalty/betrayal, respect/subversion, and purity/degradation (Graham et al., 2009).
Haidt et al. (1993) claimed that the MFT is based on evolution and is thus universal. Graham et al. (2011) tested the validity of the five-factor model using the English version of the Moral Foundations Questionnaire (MFQ; Graham et al., 2011) to collect data from people in different countries. They found that the five-factor model demonstrated a better fit than a two-factor model (individualizing/binding) or a three-factor model (autonomy, community, and divinity), which had been tested by Yilmaz, Harma, Bahçekapili, and Cesur (2016) in a study conducted in Turkey. Findings from similar studies have also demonstrated the superiority of the five-factor model (Bobbio, Nencini, & Sarrica, 2011; Bowman, 2010; Davies, Sibley, & Liu, 2014; Nilsson & Erlandsson, 2015). However, data collected from a Chinese sample has shown that the fit for the five-factor model is not as good as that of English-speaking countries (Zhang & Li, 2015). However, this may have been attributable to study limitations. First, the participants were mainly female college students, meaning that gender differences were not tested, and second, ethnic minority participants were excluded from the study, which is not representative of the whole population.
To my knowledge, no researchers have previously explored how ethnicity influences moral foundations in China In the current study, I tested the validity of the five-factor model, examined the differences in the five moral foundations among different ethnic groups, and considered the gender effect.
I had two goals in the current study. First, to perform confirmatory factor analysis of the Chinese version of the MFQ (Zhang & Li, 2015), by exploring whether the five-factor structure is more suitable than a two- or three-factor structures. Second, to perform multiple group comparison analysis and a mixed-design multivariate analysis of variance to examine whether the five moral foundations differ between men and women across ethnic groups. In other words, I was seeking to answer the following research questions:
Research Question 1: What is relevant and significant to the three ethnic groups of Tibetans, Han, and Uygur in China when they decide what is right or wrong?
Research Question 2: Is there a gender difference between men and women in China in determining what is relevant and significant when they decide what is right or wrong?
Method
Participants and Procedure
I obtained ethical approval to conduct the study from the Academic Committee of the School of Psychology, Shaanxi Normal University. People (N = 761) who took part in the study were 540 undergraduate students (71%) and 221 other volunteers (29%) who accessed the survey form online, as follows: 422 women, 339 men; 391 Han (51%), 167 Uygur (22%), 203 Tibetans (27%); age range = 17–50 years, Mage = 28.34 years, SD = 6.73. All participants were native Chinese speakers. Just under half of the participants (n = 370, 49%) could also speak their own language. The Chinese version of the MFQ and informed consent forms were distributed to participants online. Undergraduate students completed the survey by mobile phone in a classroom, and nonstudents completed the survey by mobile phone individually at their own convenience. After completing the survey at https://www.sojump.com participants received a gift worth approximately US$1 of either a prepaid phone card, yogurt, or a coupon from a website.
Measures
Graham et al. (2011) identified the psychometric properties of the MFQ. The questionnaire consists of five dimensions identified as care/harm, fairness/cheating, loyalty/betrayal, respect/subversion, and purity/degradation, and the 30 items are rated on a 6-point Likert-type scale. There are two parts to each moral dimension: relevance and judgment. For example, in the care/harm dimension, in the first part, participants are asked to rate the importance of each criterion when they make moral judgments (e.g., “Whether or not someone suffered emotionally.”). For this first part the 6-point scale is rated from 0 = not at all relevant, to 5 = extremely relevant. In the second part, participants are asked to rate the degree to which they agree with each moral judgment (e.g., “Compassion for those who are suffering is the most crucial virtue.”). Participants read 15 concrete examples and indicate their agreement or disagreement on a scale with anchors 0 = strongly disagree and 5 = strongly agree. There are three items in each of the two parts of each of the five dimensions, with a composite score formed for each moral dimension by computing the average of the six items.
Results
Data Analysis
I performed several confirmatory factor analyses using AMOS 21.0 to examine the factor structure of the Chinese version of the MFQ (Zhang & Li, 2015). I tested five theoretical models for the full 30-item MFQ, for the relevance subscales, and the judgment subscales (see Table 1). Each moral foundation was treated as a latent factor, each scale item served as a manifest variable, and the relationship between all latent factors was estimated. Care/harm and fairness/cheating are the individualizing foundations for the protection of individual rights, and loyalty/betrayal, respect/subversion, and purity/degradation are the binding foundations for the protection of group harmony (Graham et al., 2009). The five-factor model included care/harm, fairness/cheating, loyalty/betrayal, respect/subversion and sanctity. In the four-factor model, I combined care/harm and fairness/cheating into one factor (individualizing foundations). In the three-factor model, I combined loyalty/betrayal and respect/subversion into one factor (binding foundations) and estimated sanctity was a separate factor. For the two-factor model I estimated the individualizing foundations and binding foundations as separate factors. Finally, in the single-factor model all of the observed variables were loaded into one factor. Then, I used a chi-square difference test to compare the models and identify the model with the best fit.
I used the chi-square model fit index, comparative fit index (CFI), Akaike information criteria (AIC), root mean square error of approximation (RMSEA), and expected cross-validation index (ECVI) to evaluate the fit of the model. The chi-square test for absolute model fit was sensitive to sample size, so χ2/df was used as an additional model fit index. The CFI must be equal to, or greater than, 0.95 and a RMSEA below 0.06 is considered a good fit (Hu & Bentler, 1999; Steiger, 2007). The ECVI index was required to be as small as possible. See Table 1 for fit indices.
Table 1. Fit Indices of the Moral Foundations Questionnaire

Note. AIC = Akaike information criteria, CFI = comparative fit index, RMSEA = root mean square error of approximation, ECVI = expected cross-validation index, CI = confidence interval, MFQ = Moral Foundations Questionnaire.
Structural Validity
The factor models have different fit indexes (see Table 1). The model fit pattern of the full scale (30-item MFQ) test was different from those of the relevance and judgment subscale tests. The CFI of the relevance subscale was a better fit compared with both the judgment subscale and the full scale. Although the CFI of the model with the best fit was lower than the suggested acceptable fit index of .90 (Hu & Bentler, 1999), based on Kenny, Kaniskan, and McCoach (2015), RMSEA was used as a model fit measure, and the low CFI scores were not used as an automatic rejection index of the models (Davies et al., 2014).
For the relevance subscale, the five-factor model, χ2(80) = 589.56, CFI = .86, RMSEA = .11, 90% CI [.10, .11], ECVI = 1.32, was a significantly better fit than the four-factor model, Δχ2(2) = 117.12, p < .001; the three-factor model, Δχ2(7) = 181.48, p < .001; and the two-factor model, Δχ2(18) = 264.11, p < .001. Indications from the modification index suggested a potential correlation between respect item 1 (Whether or not the individual shows a lack of respect for authority) and respect item 2 (Whether or not the individual conforms to the traditions of society), and care item 2 (Whether or not the individual cares for somebody who is weak and vulnerable) and loyalty item 1 (Whether or not the individual’s actions show love for his/her country). I analyzed the relationship between these two pairs of observed variables and consulted two professors in the intercultural field. Both these experts believed that there is an inherent cultural link between the two pairs of observed variables. As a result, I linked the residuals between respect item 1 (respect of authority) and respect item 2 (conformity with tradition), and care item 2 (care for weak and vulnerable) and loyalty item 1 (love for one’s country). This improved the fit of the model (see Table 1, modified model). I used three of the most commonly reported fit statistics to evaluate the fit of the relevance subscale model as shown in Table 2. My measurement model has a relative chi-square = 6.37, CFI = 0.93, and RMSEA = 0.08. CFI values greater than 0.90 indicate good fit (Hu & Bentler, 1999). The CFI for my measurement model is greater than that in the study by Graham et al. (2011). A RMSEA between 0.05 and 0.08 indicates reasonable fit (Kline, 2005).
Table 2. Goodness-of-fit Statistics Construct for the Measurement Model in the Current Study and in the Model in the Study by Graham et al. (2011)

Next, I examined the reliabilities of each latent variable in the relevance subscale models, judgment subscale models, and full subscale models. I used Cronbach’s alpha to measure the reliability of each structure and compare it with the results of Graham et al. (2011; see Table 3). In my model, the Cronbach’s alpha of the relevance subscale models were greater than 0.6, which indicates that the constructs are marginally acceptable according to Gliner, Morgan, and Leech (2011). However, the Cronbach’s alpha of the judgment subscale models and full subscale models are not acceptable (see Table 3). The relative chi-square, CFI, RMSEA, and Cronbach’s alpha of the relevance subscale models indicate good fit.
Table 3. Reliabilities (Cronbach’s Alpha) Construct: Measurement Model and the Model Used by Graham et al. (2011)

Note. a Participants in this study N = 761, b Participants in the study by Graham et al. (2011). N = 34,476.
Multiple-Group Analysis
I performed multiple-group analysis to investigate my research questions related to gender and ethnic groups. The final measurement model was tested for consistency in fit across gender and ethnic groups. I examined models of metric invariance (difference in factor loadings) and structural invariance (difference in covariances) for gender and the three different ethnic groups. Metric invariance is tested by constraining each factor load in one set to be equal to the corresponding load in another set. Once metric invariance has been verified, structural invariance can then be tested by constraining each interfactor covariance as well as the error-term variances and covariances. The factor (latent variable) variance is unconstrained, and each variable is set to 1.0 in different groups for model identification.
Model Invariance According to Gender
I tested the consistency of the final measurement model across gender in these participants (339 men, 422 women). The unconstrained configural (equal forms) model has a reasonably good fit, χ2 = 658.83, df = 156, p < .001, relative chi-square = 4.223, RMSEA = .060, 90% CI [.055, .065], standardized root mean square residual (SRMR) = .090.
Cross-group parameter equality constraints were placed on the model in order to test for metric invariance. The metric-invariance model shows no significant decrement in fit, Δχ2 = 6.864, df = 10, p = 0.738, compared to the configural model (no cross-group constraints). Therefore, full metric invariance was attained. There are no differences between the men and women.
Model Invariance According to Ethnic Group
Consistent with the procedures used for gender, I also tested the final measurement model for consistency across the three ethnic groups of participants (391 Han, 167 Uygur, 203 Tibetans). The unconstrained configural model shows an acceptable fit (χ2 = 685.56, df = 236, p < .001). The relative chi-square (2.905) is well below any recommended reference values. The RMSEA (.050) of the configural model indicates a good fit, 90% CI [.046, .055]. The CFI of the configural model was .922, which also indicates a good fit, as well as the SRMR of .078.
Similarly, cross-group parameter equality constraints were placed on the model in order to test for metric invariance. The metric-invariance model shows a significant decrement in fit (Δχ2 = 54.484, df = 20, p < .001) compared to the configural model (no cross-group constraints). Therefore, full metric invariance is not attained. There are differences among the Han, Uygur, and Tibetans, as shown in Figures 1, 2, and 3.
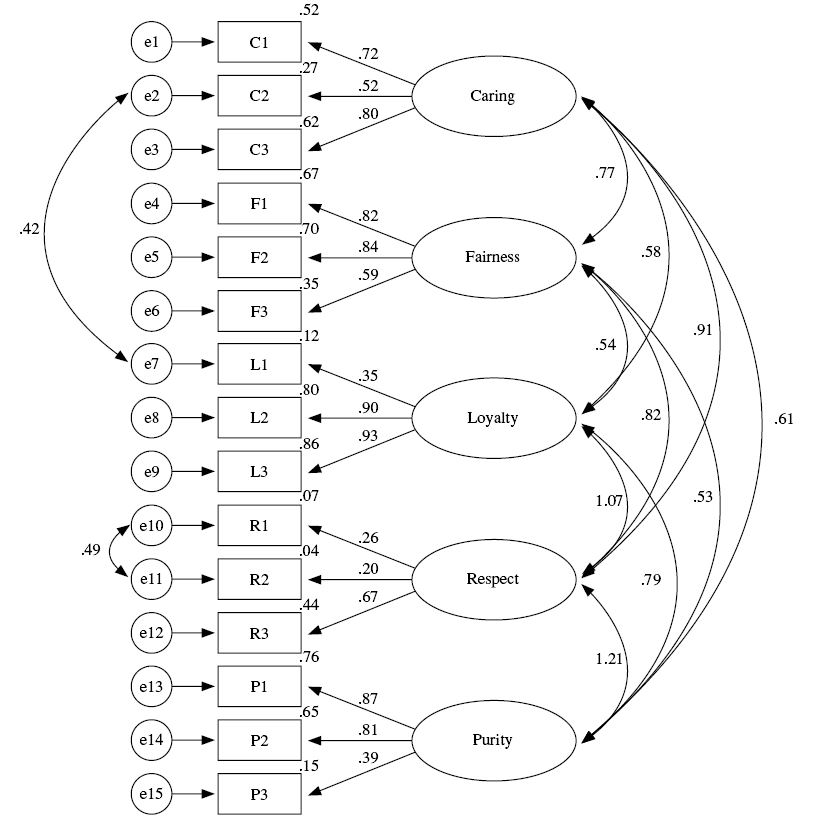
Figure 1. Measurement model results for Han participants. Unconstrained; standardized estimates. Single-headed arrows represent regression weights, double-headed arrows represent covariances, and stand-alone numbers represent variances. All other estimates shown are the same for other groups.

Figure 2. Measurement model results for Uygur participants. Unconstrained; standardized estimates. Single-headed arrows represent regression weights, double-headed arrows represent covariances, and stand-alone numbers represent variances. All other estimates shown are the same for other groups.

Figure 3. Measurement model results for Tibetan participants. Unconstrained; standardized estimates. Single-headed arrows represent regression weights, double-headed arrows represent covariances, and stand-alone numbers represent variances. All other estimates shown are the same for other groups.
Multivariate Analysis of Variance
To investigate which of the moral foundations is most important in each ethnic group, I compared the scores of the foundations for all participants by calculating the mean. I conducted a mixed-design multivariate analysis of variance to test for the interactions among gender (two levels), ethnic groups (three levels), and moral foundations (five levels). In this analysis, moral foundations were a within-subjects (repeated measures) factor consisting of the following five dimensions: care, fairness, loyalty, respect, and purity. These dimensions were measured by the mean of the items included in the measurement model. A summary of the results for these five variables is provided in Table 4.
Table 4. Descriptive Statistics for the Five Measures of Moral Foundation Between Gender and Among Ethnic Groups
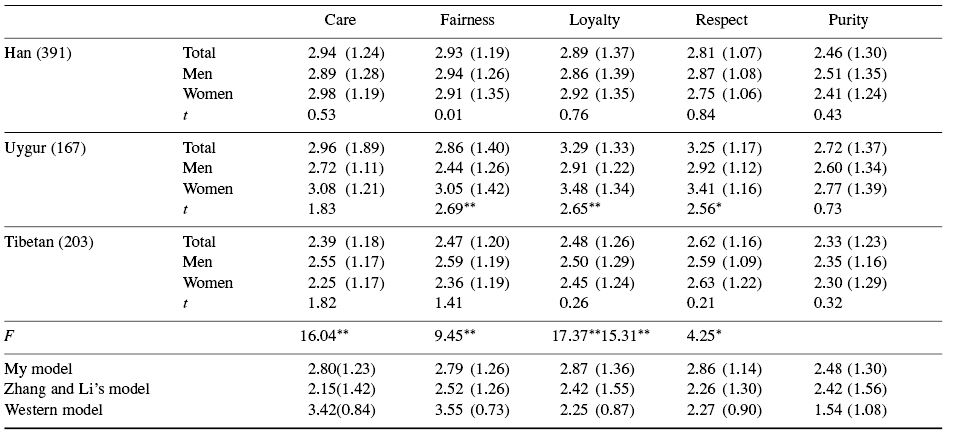
Note. Relevance subscale means obtained from the study by Zhang and Li (2015), and studies with Western samples (Graham et al., 2011; Guerra & Giner-Sorolla, 2010).
* p < .05, ** p < .01.
The results of this analysis showed significant interactions among gender and ethnicity. There were no significant main effects by gender, F(1, 761) = 1.149, p = .215. In contrast, there were significant main effects among ethnic groups, F(2, 761) = 6.222, p < .001, in every dimension of the MFQ. I then performed post hoc analysis on all pairwise comparisons among the ethnic groups. I found that scores for Tibetans were lower than those of Han and Uygur in care and fairness, and Uygur scores were higher than those of Han and Tibetans in loyalty, respect, and purity. The interactions between gender and ethnic groups were mainly significant in care, F(2, 761) = 3.320, p < .05; fairness, F(2, 761) = 5.289, p < .001; loyalty, F(2, 761) = 4.143, p < .05; and respect, F(2, 761) = 3.926, p < .05. The profile plot of Uygur women is similar to that of Uygur men, in that they placed a much greater reliance on the loyalty and respect foundations when distinguishing what is right or wrong, although the mean score of Uygur women was higher than that of Uygur men for each of the foundations. Uygur women’s mean score was higher than those of Uygur men and of Tibetan men and women; Tibetan women’s mean score was lower than those of Uygur women and Han men and women in caring (p < .05); Uygur women’s mean score was higher than those of Uygur men and Tibetan men and women (p < .05); Tibetan women’s mean score was lower than those of Uygur women and Han men and women in fairness (p < .05); and Uygur women’s mean score was higher than those of all other groups in loyalty and respect (p < .05). There was no significant difference between Han men and Han women for the five foundations; the mean scores for the foundations gradually decreased from care to purity in the Han group. This is consistent with results reported by Zhang and Li (2015), who found that Chinese Han people place a higher value on the individual-focused factors of care/harm and fairness than they do on the group-focused factors of loyalty, respect, and purity. The mean score of Tibetans for respect was higher than their score for any of the other four foundations, but the mean score of Tibetans in each of the five foundations was consistently lower than that of Han men and women and Uygur men and women, except for Uygur men in fairness. A profile plot is provided for the five dimensions between gender and among ethnic groups in Figure 4.
Discussion
In this study, I investigated whether the MFQ is a valid measure for use with different ethnic groups in China. This is, to my knowledge, the first replication of the MFT measurement model employed for ethnic groups in China. The results revealed that the model does not meet the conventional fit criteria with Chinese participants of three ethnic groups. The fit indexes of the judgment subscale models and full subscale models are lower in absolute terms than are the fit indices for the relevance subscale model. This inconsistency may be caused by the complexity of moral judgments (Nilsson & Erlandsson, 2015). I compared the goodness-of-fit results I obtained in this study with those reported by Graham et al. (2011). The resulting measurement model for the relevance subscale in my study has a good fit and is consistent with the measurement model of Graham et al.. This indicates that the use of the relevance subscale measurement model can be extended to China. However, the MFQ was a poor fit and the results showed a low level of reliability in the current study, which may be because of differences between Chinese and Western cultures. Taken together, my findings suggest that the MFQ requires further revision in order for its use in China to be valid. However, the findings also show that ethnicity is an important factor when people make moral judgments.
The present study had some limitations. I carried out the survey online and asked participants to report what they consider when determining whether something is right or wrong. However, this process did not capture their decision making in real life. This issue should be considered by future researchers. Second, the participants consisted of three representative ethnic groups in northwest China. Further investigation of the measures would require data collected from multiple ethnic groups with different cultural orientations and religious backgrounds in China. Third, although the MFT provides a framework to help psychologists develop a better understanding of human morality, the MFQ should be revised in future when used in the context of Chinese culture.
Bobbio, A., Nencini, A., & Sarrica, M. (2011). Moral Foundations Questionnaire: Italian version [In Italian]. Giornale di Psicologia, 5, 7–18. Retrieved from https://bit.ly/2MfeU5o
Bowman, N. (2010). German translation of the Moral Foundations Questionnaire - Some preliminary results. Retrieved from https://bit.ly/2K6Cbnr
Davies, C. L., Sibley, C. G., & Liu, J. H. (2014). Confirmatory factor analysis of the Moral Foundations Questionnaire: Independent scale validation in a New Zealand sample. Social Psychology, 45, 431–436. https://doi.org/10.1027/1864-9335/a000201
Gliner, J. A., Morgan, G. A., & Leech, N. L. (2011). Research methods in applied settings: An integrated approach to design and analysis (2nd ed.). New York, NY: Routledge.
Graham, J., Haidt, J., Koleva, S., Motyl, M., Iyer, R., Wojcik, S. C., & Ditto, P. H. (2013). Moral foundations theory: The pragmatic validity of moral pluralism. In P. Devine & A. Plant (Eds.), Advances in experimental social psychology (Vol. 47, pp. 55–130). San Diego, CA: Elsevier. https://doi.org/10.1016/b978-0-12-407236-7.00002-4
Graham, J., Haidt, J., & Nosek, B. A. (2009). Liberals and conservatives rely on different sets of moral foundations. Journal of Personality and Social Psychology, 96, 1029–1046. https://doi.org/10.1037/a0015141
Graham, J., Nosek, B. A., Haidt, J., Iyer, R., Koleva, S., & Ditto, P. H. (2011). Mapping the moral domain. Journal of Personality and Social Psychology, 101, 366–385. https://doi.org/10.1037/a0021847
Guerra, V. M., & Giner-Sorolla, R. (2010). The Community, Autonomy, and Divinity Scale (CADS): A new tool for the cross-cultural study of morality. Journal of Cross-Cultural Psychology, 41, 35–50. https://doi.org/10.1177/0022022109348919
Haidt, J. (2001). The emotional dog and its rational tail: A social intuitionist approach to moral judgment. Psychological Review, 108, 814–834. https://doi.org/10.1037/0033-295X.108.4.814
Haidt, J. (2007). The new synthesis in moral psychology. Science, 316, 998–1002. https://doi.org/10.1126/science.1137651
Haidt, J. (2012). The righteous mind: Why good people are divided by politics and religion. New York, NY: Vintage Books.
Haidt, J., & Joseph, C. (2004). Intuitive ethics: How innately prepared intuitions generate culturally variable virtues. Daedalus, 133, 55–66. https://doi.org/10.1162/0011526042365555
Haidt, J., Koller, S. H., & Dias, M. G. (1993). Affect, culture, and morality, or is it wrong to eat your dog? Journal of Personality and Social Psychology, 65, 613–628. https://doi.org/10.1037/0022-3514.65.4.613
Hu, L.-T., & Bentler, P. M. (1999). Cutoff criteria for fit indexes in covariance structure analysis: Conventional criteria versus new alternatives. Structural Equation Modeling: A multidisciplinary journal, 6, 1-55. https://doi.org/10.1080/10705519909540118
Kenny, D. A., Kaniskan, B., & McCoach, D. B. (2015). The performance of RMSEA in models with small degrees of freedom. Sociological Methods & Research, 44, 486–507. https://doi.org/10.1177/0049124114543236
Kline, R. B. (2005). Principles and practice of structural equation modeling (2nd ed.). New York, NY: Guilford Press.
Kohlberg, L. (1969). Stage and sequence: The cognitive-developmental approach to socialization. In D. A. Goslin (Ed.), Handbook of socialization theory (pp. 347–480). Chicago, IL: Rand McNally.
Nilsson, A., & Erlandsson, A. (2015). The moral foundations taxonomy: Structural validity and relation to political ideology in Sweden. Personality and Individual Differences, 76, 28–32.
Steiger, J. H. (2007). Understanding the limitations of global fit assessment in structural equation modeling. Personality and Individual Differences, 42, 893–898. https://doi.org/10.1016/j.paid.2006.09.017
Yilmaz, O., Harma, M., Bahçekapili, H. G., & Cesur, S. (2016). Validation of the Moral Foundations Questionnaire in Turkey and its relation to cultural schemas of individualism and collectivism. Personality and Individual Differences, 99, 149–154. https://doi.org/10.1016/j.paid.2016.04.090
Zhang, Y., & Li, S. (2015). Two measures for cross-cultural research on morality: Comparison and revision. Psychological Reports, 117, 144–166. https://doi.org/10.2466/08.07.pr0.117c15z5
Table 1. Fit Indices of the Moral Foundations Questionnaire
Note. AIC = Akaike information criteria, CFI = comparative fit index, RMSEA = root mean square error of approximation, ECVI = expected cross-validation index, CI = confidence interval, MFQ = Moral Foundations Questionnaire.
Table 2. Goodness-of-fit Statistics Construct for the Measurement Model in the Current Study and in the Model in the Study by Graham et al. (2011)
Table 3. Reliabilities (Cronbach’s Alpha) Construct: Measurement Model and the Model Used by Graham et al. (2011)
Note. a Participants in this study N = 761, b Participants in the study by Graham et al. (2011). N = 34,476.
Figure 1. Measurement model results for Han participants. Unconstrained; standardized estimates. Single-headed arrows represent regression weights, double-headed arrows represent covariances, and stand-alone numbers represent variances. All other estimates shown are the same for other groups.
Figure 2. Measurement model results for Uygur participants. Unconstrained; standardized estimates. Single-headed arrows represent regression weights, double-headed arrows represent covariances, and stand-alone numbers represent variances. All other estimates shown are the same for other groups.
Figure 3. Measurement model results for Tibetan participants. Unconstrained; standardized estimates. Single-headed arrows represent regression weights, double-headed arrows represent covariances, and stand-alone numbers represent variances. All other estimates shown are the same for other groups.
Table 4. Descriptive Statistics for the Five Measures of Moral Foundation Between Gender and Among Ethnic Groups
Note. Relevance subscale means obtained from the study by Zhang and Li (2015), and studies with Western samples (Graham et al., 2011; Guerra & Giner-Sorolla, 2010).
* p < .05, ** p < .01.
This study was supported by a grant awarded to Jun Du from the Fundamental Research Funds for the Central Universities (2016TS065).