Multigroup analysis and measurement equivalence: Korean and Chinese consumers of Korean cosmetics
Main Article Content
We examined the concepts and importance of measurement equivalence tests and how failing to conduct these tests can hinder multigroup analyses, particularly for cross-cultural or cross-national studies. To do so, we developed a conceptual model of Korean cosmetics comprising product characteristics, consumer satisfaction, and repurchase intention, and administered a survey assessing these variables to 356 Korean and 358 Chinese consumers. We then conducted confirmatory factor analyses and multigroup analyses. The measurement equivalence test results revealed significant differences in the measurement methods for Korean and Chinese consumers, necessitating the development of separate modified models. Specifically, the model using cosmetic product characteristics as a single factor was more suitable for Chinese than for Korean consumers. Therefore, we were able to develop separate research models appropriate for each group. Our results also highlight the importance of assessing measurement invariance for social science researchers desiring to perform multigroup analyses in cross-national studies.
Expanding international markets and the growing number of overseas travelers have triggered numerous cross-national and cross-cultural studies, which has raised awareness of the need for measurement equivalence tests (Craig & Douglas, 2005; Mullen, 1995; Steenkamp & Baumgartner, 1998). Measurement equivalence tests are used to determine whether a number of groups have the same understanding of a given construct and are often applied prior to conducting multigroup analyses. Several studies have been conducted of the use and efficiency of these tests (Craig & Douglas, 2005; Mullen, 1995; Myers, Calantone, Page, & Taylor, 2000; Steenkamp & Baumgartner, 1998).
We examined measurement equivalence tests and their importance in cross-national studies. Three examples are provided: First, in the 1970s a bicycle was a means to transport products and people in both Korea and Vietnam. However, today, few Korean people consider bicycles as means of transportation; instead, bicycles are widely perceived as sports or leisure equipment and most are designed accordingly (Beck, 2014). Given these changed circumstances, bicycles designed for delivery or transportation have little influence on consumer satisfaction in Korea. In Vietnam, however, bicycles continue to be widely used and considered a means of transportation and delivery. Thus, bicycles for sports and leisure have little impact on consumer satisfaction, whereas those for transportation play a major role (Xu, Yang, Jin, Qu, & Hou, 2016). This means that Korean and Vietnamese consumers may differ in their perception of satisfaction derived from bicycles. Thus, a survey conducted in these two countries on consumer satisfaction with bicycles would have to account for different attributes.
Second, in terms of the functionalities of gas stations in Korea and the United States, most gas stations in Korea offer 24/7 service rendered by part-time employees, such as guiding incoming cars, filling the vehicle with the requested amount of fuel, and offering customers various complementary items associated with ongoing promotions and events (Lee, Shin, Yoo, & Yoon, 2011). Thus, it is reasonable to assume that consumer satisfaction at a gas station in Korea depends on the quality of customer service. By contrast, most gas stations in the United States are self-service (Campbell, Maglio, & Davis, 2011). Thus, customer service plays no role in gas station consumer satisfaction in the United States, whereas the utility level of gas-pumping machines and gas prices have a significant influence (Campbell et al., 2011). Therefore, it would be inappropriate to evaluate consumer satisfaction with gas stations in both countries using identical standards.
Third, the rise in popularity of Korean pop (K-Pop) music and culture has led to a rapid increase in not only the numbers of so-called “youkers” (i.e., Chinese tourists; Shen, 2016) in Korea, but also Korean cosmetics sales. Between 2007 and 2012 the numbers of Chinese tourists visiting Korea tripled and their vacation spending amount increased seven-fold. If this rate persists, the number of Chinese tourists entering Korea is expected to be more than 10 million annually by 2020. This also means a production inducement (gross amount arising directly and indirectly from industrial sectors to meet final demand) of  68 trillion (US$60.5 million), an added-value inductive (e.g., final demand value creation from consumption, investments, and exports) of 32.4 trillion (US$28.8 million), and job creation for 898,000 people in Korea. Further, shopping-related expenditures by Chinese tourists have steadily increased from 30.1% in 2010 to 44.9% in 2011, 44.6% in 2012, and 52.5% in 2013. These expenditures are expected to increase considerably to more than 30 trillion (US$26.7 million) by 2020, which will account for approximately 8% of the Korean retail market. In particular, Chinese tourists’ expenditure on Korean cosmetics is anticipated to increase from the 1.8 trillion (US$1.6 million) in 2014 to 5.2 trillion (US$4.6 million) by 2020. Moreover, it is expected that Chinese tourists will account for approximately 30.1% of the population in Korea by 2020 (Shen, 2016).
Given that consumer perspectives of an object or construct differ by culture, in this study we first examined the need for a measurement equivalence test when using multigroup analyses in cross-national studies, and then conducted this test to determine the differences between Korean and Chinese consumers’ perspectives of Korean cosmetics. In particular, we compared results obtained before and after the test, and designed study models tailored to each group. We also sought to contribute to the literature on the development of the Korean cosmetics industry.
Literature Review and Hypotheses
Measurement Equivalence Tests
Measurement equivalence tests are used to define whether measurement tools or models for different samples provide identical results. The tests are often conducted before a multigroup analysis and verified through multigroup confirmatory factor analysis (CFA). Mullen (1995), Myers et al. (2000), and Steenkamp and Baumgartner (1998) proposed the following five measurement equivalence model types: unconstrained model (free model); factor-loading-constrained model (λ constrained model); covariance-constrained model (Φ constrained model); factor-loading and covariance-constrained model (λ, Φ constrained model); and factor-loading, covariance model, and error variance-constrained model (λ, Φ, θ constrained model).
Arguing for the importance of measurement equivalence testing, Mullen (1995) questioned the credibility of results previously obtained from cross-national or cross-cultural studies given that respondents’ perspectives differ by culture, language, and even daily rituals. Many researchers have suggested verifying the appropriateness of implementation of multigroup analysis prior to implementing cross-national studies (Craig & Douglas, 2001; Myers et al., 2000).
Myers et al. (2000) suggested that if the results of between-group measurement equivalence tests are not identical, each group holds different beliefs about a given construct or variable; thus, it would be inappropriate to proceed with a multigroup analysis. In fact, Myers et al. attempted to conduct a multigroup analysis using a research model of the influences of attitude toward the brand and attitude toward advertising, on purchasing intention among samples of Korean and American consumers. However, they identified problems in two of the three latent variables in that the results of exploratory factor analysis and confirmatory factor analysis by each group failed to meet a reliable level. As a result, they discontinued the analysis at the measurement equivalence test stage and reported their findings without moving on to multigroup analysis.
Few research papers feature proper and thorough investigations of measurement equivalence tests (He, Merz, & Alden, 2008). He et al. (2008) proposed two explanations for this lack: First, conducting a measurement equivalence test for a multigroup analysis requires a considerable sample size for each country, which can be difficult to obtain. Second, if the study variables are measured independently, the equivalence test itself becomes impossible. He et al. studied 21 research papers featuring samples from 10 countries and found that only one conducted a measurement equivalence test using CFA. Further, in 7 out of 21 studies a single measurement item was used, which makes conducting measurement equivalence tests rather difficult; thus, the tests tend to be omitted.
Yu and Kim (2017) examined Korea-based papers published from 2010 until 2015 in the Korean Management Review and Korean Journal of Business Administration, and found that only 19% featured multigroup analyses performed with measurement equivalence tests. Evidently, while the need for measurement equivalence tests is a topic of continuous scholarly discussion, in reality, few researchers properly execute such tests.
Self-Determination Theory
Self-determination theory is often utilized to measure the perceived locus of causality, such that self-determination is high when the cause of action is perceived to be within oneself and low when the cause is perceived to be external to the self (Deci, Vallerand, Pelletier, & Ryan, 1991). A unique characteristic is that both high and low self-determination are intentional actions and the difference between the two relates to the process of regulating behaviors (Deci et al., 1991).
Intrinsic and extrinsic motivations reflect self-determinism (Ryan & Deci, 2000). Intrinsic motivation denotes behaviors resulting from one’s own decision making, whereas extrinsic motivation indicates behaviors caused by external factors. However, according to self-determination theory, this distinction can be fragmented. Self-determination is not limited to intrinsic motivation because individuals accept their social roles or external pressures as their own choices and perceive even behaviors resulting from external forces as an outcome of their own decisions (Ryan & Deci, 2000). Through this process of internalization different degrees of self-determination are applied to divide extrinsic motivation into various categories (Kleiber, Walker, & Mannell, 2011).
Extrinsic motivation can be classified on the basis of self-determination stages: (i) extrinsic regulation, in which an action is caused by external factors, such as rewards or threats of punishment; (ii) introjected regulation, where extrinsic regulation causes a person to experience psychological pressure to perform an action and to avoid feelings of guilt or lowered self-esteem; (iii) identified regulation, wherein a person chooses to perform an action by giving meaning and importance to it; and (iv) integrated regulation, in which a person chooses to perform an action that aligns with their beliefs or values (Ryan & Deci, 2006). All categories except extrinsic regulation indicate the internalization of extrinsic factors, wherein an individual perceives their actions to be self-determined. Further, the degree of self-determination varies by regulation type: the level of self-determination increases in the order of introjected, identified, and integrated regulation (Pelletier, Fortier, Vallerand, & Brière, 2001). Integrated regulation, which has the highest self-determination level, is similar to intrinsic motivation in that engaging in the action creates feelings of pleasure and satisfaction. However, at the same time, it differs from intrinsic motivation in that the purpose of the action is not inherent but external to the action (Ryan & Deci, 2006). Vallerand and Bissonnette (1992) referred to such extrinsic motivation with internalization as a form of self-determination.
Self-determination theory can also be used to identify the dynamic aspects of motivation. In other words, self-determination exists as not only a binary representation of intrinsic versus extrinsic motivation, but also involves internalization (Pelletier et al., 2001). Thus, it is necessary to pay attention to both extrinsic and intrinsic motivations because many real-life experiences are caused by each of these types of motivation. Self-determination theory can be used to explain the internalization of external regulatory factors and the granting of consumer autonomy. While many behaviors are demonstrated for purposes other than the pleasure of engaging in the act itself, humans experience intrinsic self-determination by assigning meaning and spontaneity to their actions (Deci & Ryan, 1985).
In addition to intrinsic and extrinsic motivation types, amotivation, which is a state in which neither intrinsic nor extrinsic motivations exist and a person performs an action (or not) without knowing its purpose (Deci & Ryan, 2008; Ryan & Deci, 2000), is proposed in self-determination theory. When performing an action in a state of amotivation, a person (i) does not place any value on the action or outcome of that action, (ii) cannot find a link between the action and its outcome, or (iii) perceives it to be difficult to control or change the outcome of the action. Therefore, they cannot experience self-determination when performing an action under amotivation. Amotivation is similar to the state of learned helplessness in that individuals experience a loss of their sense of control (Deci & Ryan, 2008; Ryan & Deci, 2000).
Combining the above theoretical bases, we used self-determination theory to examine differences in Korean and Chinese consumers regarding repurchase intention for and consumer satisfaction with Korean cosmetic products. The basic human desire for autonomy involves individuals wanting to perform voluntary actions; however, the degree of autonomy differs by culture and country. We anticipated that the higher the relative autonomy toward each country’s culture is, the bigger will be the factor loading value of measurement items of Korean cosmetics perceived by Korean versus Chinese consumers.
Consumers of Korean Cosmetics
The Korean cosmetics industry is receiving worldwide attention and mass popularity at present, particularly with regard to the rapidly increasing number of youkers visiting Korea. According to researchers of trade associations and related fields (Shen, 2016), the total income for the Korean cosmetics industry from Chinese tourists between January and July 2015, was US$1,674,581,000, which is 36.1% higher than the same period in 2014. More specifically, Korea showed the second largest growth in the cosmetics industry worldwide, with sales from January to July 2014 and January to July 2015 increasing by 250.6% (US$370 million). Further, the occupancy ratio (the ratio of the sum of the occupancy time measured per unit of time) in China was 22.1%, representing a 12.3% increase from the 9.8% ratio reported in the previous year (Shen, 2016).
This rapidly growing demand for Korean cosmetics has prompted numerous related studies. For instance, K. J. Kim and Oh (2013) reported that Chinese consumers with high levels of interest in Korean cosmetics demonstrate significantly stronger brand identification. In addition, involvement and cognitive excellence considerably influence consumers’ perspectives of cosmetics. For example, according to J. S. Kim and Lee (2013), cultural elements such as K-Pop and its image impact on the perceived quality of Korean cosmetics among Chinese consumers. More specifically, perceived quality factors, such as brand image, price, performance, and design, influence consumers’ product satisfaction (S.-J. Kim, 2014) and significantly influence repurchase intentions and the likelihood of recommending the products to others. Oh and Lee (2010) examined Chinese women who were college students and reported that cosmetics’ brand image is a crucial factor affecting repurchase intentions. In addition, S.-S. Kim (2012) argued that consumer groups hold different perspectives of certain Korean and foreign cosmetic products, which can be attributed to 7 out of 16 significantly different qualities (color–beauty, ingredient, appreciation event, brand credibility, fragrance, price satisfaction, price dissatisfaction, service, fashion, container design, one-time usage, ease of purchase, color–unique, skin absorption, store interior, quality). Thus, we assumed Korean and Chinese consumers would hold different perspectives of Korean cosmetic product characteristics.
Study Model and Hypotheses
We developed the model shown in Figure 1 to examine the product characteristics of Korean cosmetics and their influence on overall consumer satisfaction and repurchase intentions. Nationality was added as a moderating variable because unlike Korean consumers, Chinese consumers may behave in a discriminative manner toward a given product. That is, there may be a difference in influence on satisfaction and repurchase intention of Korean cosmetics between Korean and Chinese consumers.
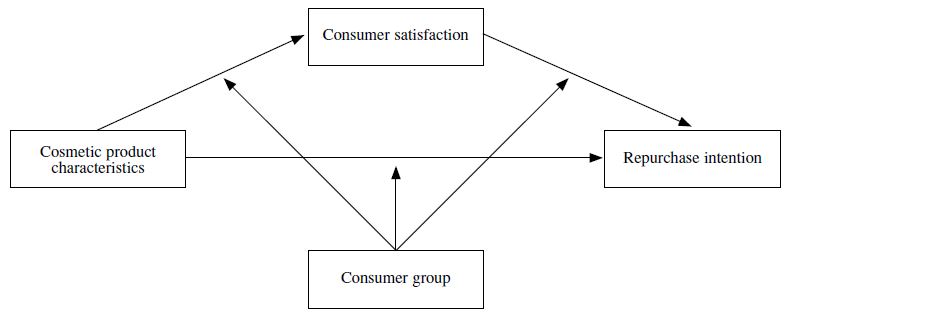
Figure 1. Proposed model.
Drawing on the above literature review, we proposed the following hypotheses:
Hypothesis 1a: Korean cosmetic products’ characteristics will have a positive influence on consumer satisfaction and repurchase intention.
Hypothesis 1b: Satisfaction derived from purchasing Korean cosmetic products will have a positive impact on consumers’ repurchase intention.
Hypothesis 2: There will be significant differences in influence on satisfaction and repurchase intention between Korean and Chinese consumers regarding Korean cosmetics purchase behaviors.
Hypothesis 3a: Korean and Chinese consumers will have varying perspectives of Korean cosmetic product characteristics.
Hypothesis 3b: Korean consumers will show higher levels of consumer satisfaction and repurchase intentions in relation to the influence of the product characteristics of Korean cosmetics than will Chinese consumers.
Method
Participants and Procedure
Table 1 shows the demographic characteristics of our participants. We surveyed Korean and Chinese consumers on a popular street in Seoul, South Korea, where cosmetics stores are concentrated. We targeted consumers who had had at least one purchase experience with a Korean cosmetics product. Of 400 surveys completed by Korean participants, 356 were valid, and of 400 surveys completed by Chinese participants, 358 were valid.
Table 1. Demographic Characteristics of Respondents

Note. N = 714.
Measures
In the case of the Chinese questionnaire, a translator converted the questionnaire into Chinese. Next, a second translator converted the Chinese translation copy into Korean again. Last, using back-translation, a third translator checked the accuracy of the previous two rounds of translation.
We selected and modified our survey items from H. S. Kim’s (2009) study of Korean and Chinese consumers. Participants rated all items on a 5-point Likert scale ranging from 1 (strongly disagree) to 5 (strongly agree).
Items relating to the characteristics of cosmetics product were as follows: “The more expensive a product is, the greater is its quality” (sales price), “I like the design of Korean cosmetic products” (product design), “Korean cosmetics are good-quality products” (product quality), “Korean cosmetics have a consistently good reputation” (brand reputation), “Korean cosmetics are very safe” (product safety), “Korean cosmetics deliver the promised results” (product effectiveness), “Korean cosmetics are easy to use” (ease of use), and “Korean cosmetics suit my skin” (compatibility).
Items relating to consumer satisfaction were as follows: “I’m satisfied with this product” (product satisfaction), “I’m satisfied with this product’s manufacturer” (brand satisfaction), and “I’m satisfied with the overall characteristics of this product” (overall satisfaction).
Finally, items relating to repurchase intention were as follows: “I will continue to use the same product in the future” (repurchase intention), “I have no intention of using any other product” (switching intention), and “I will recommend this product to others” (product recommendation).
Results
Descriptive Statistics
Table 2 shows the basic statistical results for each measured variable.
Table 2. Descriptive Statistics for Variables

Reliability
Table 3 shows the internal consistency reliabilities of the measured items for both groups. Cronbach’s alpha for both Korean and Chinese consumers was over .80, indicating adequate reliability; thus, we retained all items.
Table 3. Internal Consistency Reliability Results

Validity
We conducted a CFA to investigate the validity of the measured items. Figure 2 presents the measurement models and model fit indices. The analysis revealed that the model fit for Chinese consumers was more adequate than that for Korean consumers.

Figure 2. Confirmatory factor analysis results. GFI = goodness-of-fit index, AGFI = adjusted goodness-of-fit index, IFI = incremental fit index, CFI = comparative fit index, RMR = root mean square residual, RMSEA = root mean square error of approximation.
Table 4 shows the standardized factor loadings for each group.
Table 4. Measurement Model Resulting From Confirmatory Factor Analysis

Note. a The variance of the internal factors is to be fixed as 1.
Almost all factor loadings for the measurement items were greater than .50 for both groups and the t values were significant (p < .05). However, the standardized factor loading for brand reputation was .45 for the Korean group and .72 for Chinese consumers. Because we used a cross-national research design, we used brand reputation for the analysis. Table 5 shows the correlations among constructs in the CFA.
Table 5. Correlations Among Constructs

Structural Equation Modeling
The model fit was the same as that of the CFA because they are equivalent models. Figure 3 presents the analyzed conceptual model and related results for the Korean and Chinese consumers obtained using Amos 20.0.

Figure 3. Model estimates. GFI = goodness-of-fit index, AGFI = adjusted goodness-of-fit index, IFI = incremental fit index, CFI = comparative fit index, RMR = root mean square residual, RMSEA = root mean square error of approximation.
Table 6 presents the results of the conceptual model for both groups.
Table 6. Standardized Structural Estimates

Note. * p < .05, ** p < .01.
Multigroup Analysis
Next, we conducted a multigroup analysis to verify the significance of the path coefficients for both groups. We did this by calculating the chi-square difference (Δχ2) between two models: a free model that did not constrain the path between the two groups and a constrained model that imposed constraints between the two groups. The results revealed a significant difference (Δχ2 = 7.32 > 3.84) from satisfaction to repurchase intention between the two groups, and showed that the path for the Korean consumers (γ = .71) was statistically significantly stronger than that for the Chinese consumers (γ = .26).
Table 7. Conceptual Multigroup Analysis Results

Measurement Equivalence Test
Ordinarily, the analysis would be discontinued at the stage of the multigroup analysis; however, our goal was to investigate the perceptions of consumers from two countries. Thus, we conducted a measurement equivalence test for the characteristics of the cosmetic products, the results of which are presented in Table 8.
Table 8. Measurement Equivalence Test Results

Note. CFI = comparative fit index, RMSEA = root mean square error of approximation.
There were significant differences between the free and factor-loading-constrained models (716.541 − 800.920 = 84.379 > 19.675; df = 11), indicating that Korean and Chinese consumers had a different understanding of the construct of cosmetics products’ characteristics. Myers et al. (2000) urged researchers to reconsider moving onto structural equation modeling when a measurement equivalence test shows significant differences between groups. Therefore, to determine differences between both groups in terms of the construct, we conducted an exploratory factor analysis of the characteristics of the cosmetics products (see Table 9).
Table 9. Exploratory Factor Analysis Results

The results demonstrated differing patterns for Korean and Chinese consumers. We grouped eight variables into one category for the Chinese consumers, but the same variables were grouped into two categories for the Korean customers: internal factors, which refer to a cosmetic product’s quality and function (convenience, safety, effectiveness, and compatibility), and external factors, which denote a cosmetic product’s external elements (sales price, design, and brand popularity). In other words, Korean consumers had a two-fold perspective of the characteristics of Korean cosmetics products—that is, they considered the product’s internal factors to be incongruent with the external ones—whereas Chinese consumers had a unidimensional perspective. Therefore, we conducted a modified form of CFA for the Korean and Chinese consumers (see Figure 4).

Figure 4. Modified confirmatory factor analysis results. GFI = goodness-of-fit index, AGFI = adjusted goodness-of-fit index, IFI = incremental fit index, CFI = comparative fit index, RMR = root mean square residual, RMSEA = root mean square error of approximation.
As the modified CFA results show, when categorized on the basis of the cosmetic products’ characteristics, the model fit for the Korean group was superior to that for the Chinese group. More specifically, the first CFA model showed an adequate fit for the Chinese group, whereas the second CFA model was more adequate for the Korean consumer group. In other words, the model fit changed depending on the model used. These results highlight the need to separate the two groups and, accordingly, design separate research models (see Figure 5).

Figure 5. Modified model estimates. GFI = goodness-of-fit index, AGFI = adjusted goodness-of-fit index, IFI = incremental fit index, CFI = comparative fit index, RMR = root mean square residual, RMSEA = root mean square error of approximation.
Table 10 presents the path coefficients of the modified Korean consumer model.
Table 10. The Modified Conceptual Model for the Korean Group

Note. ** p < .01.
The study results reveal that the path coefficients of the internal factors were significant within all paths, whereas those of the external factors had no direct influence on repurchase intentions. This means that external factors alone did not motivate repurchasing among Korean consumers.
Discussion
Research Summary and Implications
In this study we explored the concept of measurement equivalence tests and their importance, particularly when conducting cross-national studies. In addition, we investigated the possible issues when proceeding to a multigroup analysis without satisfying measurement equivalence. The results from the study are as follows: First, drawing on the extant literature, we employed the characteristics of Korean cosmetic products as an independent variable and set up CFA models for Chinese and Korean consumer groups. We found that the standardized factor loadings for both groups were greater than .50, with a t value greater than 1.97, except for one item for the Korean consumer group. In addition, the model fit was considerably better for the Chinese than the Korean consumer group.
Second, the characteristics of cosmetic products significantly influenced consumer satisfaction and repurchase intention, and consumer satisfaction influenced consumers’ repurchase intention. This finding is consistent with those of previous researchers (S.-J. Kim, 2014). Further, the results of the multigroup analysis showed significant between-group differences and the path from satisfaction to repurchase intention was considerably stronger for the Korean group than the Chinese group.
Third, we conducted a measurement equivalence test for the two groups to check for differences in the context of the construct of cosmetics products’ characteristics. The results showed a significant path gap between the two groups. To further investigate this phenomenon, we conducted an exploratory factor analysis and found that the products’ characteristics can be categorized into two factors for the Korean group, whereas the characteristics can be combined into a single factor for the Chinese group. More specifically, contrary to our initial expectations, Korean consumers had a two-dimensional perspective of cosmetics, comprising internal and external factors; that is, Korean consumers did not always equate a product’s popularity or expensive sales price with its quality. This can be largely attributed to mass media advertisements creating awareness among Korean consumers that there is no significant difference between expensive and cheap cosmetic products.
Fourth, we performed a modified CFA of the characteristics of the cosmetic products using the two subcategories of internal and external factors. The results indicate that the model fit for the Korean consumer group was more adequate than that for the Chinese consumer group.
Finally, we used a modified conceptual model to analyze the degree of influence of internal and external factors in the Korean consumer group. We found that the former had a more significant effect on consumer satisfaction and repurchase intentions, whereas the latter showed no direct influence on repurchase intentions. In other words, Korean consumers were less likely to repurchase a product simply on the basis of its design. Instead, they preferred to use it and then determine whether it is worthy of repurchase, which may be because of the rising popularity of low-price cosmetics among Korean consumers. This also suggests that the cosmetics purchasing patterns for Korean consumers differ from those of Chinese consumers because the latter are heavily influenced by factors such as Korean culture, television, and K-Pop; thus, they generally have high opinions of Korean cosmetics.
We have derived the following implications from this study’s results: First, self-determination theory can be used to explain the differences in Korean and Chinese consumers’ satisfaction with and repurchase intention for Korean cosmetic products. The basic human desire for autonomy influences Korean and Chinese consumers’ satisfaction and repurchase intentions, which further differ by culture and country. That is, the factor-loading value for measurement items for Korean and Chinese consumers’ perception of Korean cosmetic products was higher when the relative autonomy in each country’s culture was greater.
Second, we statistically analyzed the differences between the two groups’ perceptions of Korean cosmetics products by conducting a multigroup analysis and measurement invariance test. By comparing the results obtained before and after the test, we were able to develop separate research models appropriate for each group. Our results also highlight the importance of assessing measurement invariance for social science researchers desiring to perform multigroup analyses in cross-national studies.
Finally, perceived consumer satisfaction and repurchase intentions differed between Korean and Chinese consumers. Therefore, it is necessary to recognize changes in consumer patterns (e.g., personal and cultural desire for autonomy) and make efforts to enhance the competitiveness of the cosmetics industry to maximize purchasing rates through tourism and foreign exchanges.
Limitations and Future Research Directions
Despite its theoretical and practical contributions, this study is not free from limitations. First, we collected our data from a specific street in Seoul and from participants who intended to buy cosmetics products. Thus, the results may not be generalizable to all Korean and Chinese consumers. Moreover, the Chinese participants comprised tourists visiting the famous cosmetics street in Seoul, whose perspectives may differ from those of cosmetics customers in Mainland China. To resolve these limitations, future researchers should consider collecting data from both residents of Mainland China and Chinese tourists visiting Korea.
Baek, J. M. (2014). The meaning of bicycle tourism as leisure culture [In Korean]. Korean Journal of Sport Studies, 53, 571–579. Retrieved from https://bit.ly/2D1cN0X
Campbell, C. S., Maglio, P. P., & Davis, M. M. (2011). From self-service to super-service: A resource mapping framework for co-creating value by shifting the boundary between provider and customer. Information Systems and e-Business Management, 9, 173–191. https://doi.org/b6g23q
Craig, C. S., & Douglas, S. P. (2001). Conducting international marketing research in the twenty-first century. International Marketing Review, 18, 80–90. https://doi.org/d3gd5z
Craig, C. S., & Douglas, S. P. (2005). International marketing research. Chichester, UK: Wiley.
Deci, E. L., & Ryan, R. M. (1985). The General Causality Orientations Scale: Self-determination in personality. Journal of Research in Personality, 19, 109–134. https://doi.org/b4mqqv
Deci, E. L., & Ryan, R. M. (2008). Facilitating optimal motivation and psychological well-being across life’s domains. Canadian Psychology/Psychologie Canadienne, 49, 14–23. https://doi.org/b3j2vd
Deci, E. L., Vallerand, R. J., Pelletier, L. G., & Ryan, R. M. (1991). Motivation and education: The self-determination perspective. Educational Psychologist, 26, 325–346. https://doi.org/dk7ttj
He, Y., Merz, M. A., & Alden, D. L. (2008). Diffusion of measurement invariance assessment in cross-national empirical marketing research: Perspectives from the literature and a survey of researchers. Journal of International Marketing, 16, 64–83. https://doi.org/fmdvw5
Kim, H. S. (2009). A comparative study of whitening cosmetics purchases among Korean and Chinese consumers [In Korean]. Journal of the Korean Society of Cosmetology, 15, 891–909. Retrieved from https://bit.ly/2Mr9ZLM
Kim, J. S., & Lee, H. M. (2013). The influence of the Korean wave on Chinese consumers’ intention to purchase Korean cosmetics [In Korean]. International Area Studies Review, 17, 195–217.
Kim, K. J., & Oh, D. W. (2013). The effects of the Korean wave on brand recognition of low-priced Korean cosmetics in China [In Korean]. Journal of Cultural Industry Studies, 13, 1–10. Retrieved from https://bit.ly/2njwdEy
Kim, S.-J. (2014). Chinese tourists’ customer satisfaction with and behavioral intention to make purchases in the Korean cosmetics market [In Korean]. Korean Management Consulting Review, 14, 109–122. Retrieved from https://bit.ly/2MxMPUe
Kim, S.-S. (2012). Preference for domestic versus imported cosmetics brands [In Korean]. Journal of the Korea Fashion and Costume Design Association, 14, 69–80. Retrieved from https://bit.ly/2nm7Mqb
Kleiber, D. A., Walker, G. J., & Mannell, R. C. (2011). A social psychology of leisure. State College, PA: Venture.
Lee, Y. K., Shin, M. S., Yoo, D. K., & Yoon, N. S. (2011). The impact of gas-station characteristics on customer evaluations and loyalty: The perspective of environmental psychology [In Korean]. Journal of the Korean Data Analysis Society, 13, 1003–1019. Retrieved from https://bit.ly/2SjgiVc
Mullen, M. R. (1995). Diagnosing measurement equivalence in cross-national research. Journal of International Business Studies, 26, 573–596. https://doi.org/fjgsqq
Myers, M. B., Calantone, R. J., Page, T. J., Jr., & Taylor, C. R. (2000). An application of multiple-group causal models in assessing cross-cultural measurement equivalence. Journal of International Marketing, 8, 108–121. https://doi.org/drz4f6
Oh, H. R., & Lee, S. J. (2010). The effects of Korea’s national image on attitudes toward Korean products in the Chinese cosmetics market [In Korean]. Korean Journal of Advertising and Public Relations, 12, 321–347. Retrieved from https://bit.ly/2Oof9c1
Pelletier, L. G., Fortier, M. S., Vallerand, R. J., & Brière, N. M. (2001). Associations among perceived autonomy support, forms of self-regulation, and persistence: A prospective study. Motivation and Emotion, 25, 279–306. https://doi.org/bh8xcv
Ryan, R. M., & Deci, E. L. (2000). Intrinsic and extrinsic motivations: Classic definitions and new directions. Contemporary Educational Psychology, 25, 54–67. https://doi.org/dxq9qk
Ryan, R. M., & Deci, E. L. (2006). Self-regulation and the problem of human autonomy: Does psychology need choice, self-determination, and will? Journal of Personality, 74, 1557–1586. https://doi.org/bnnq4r
Shen, J. A. (2016). Economics of youkers [In Korean]. LG Business Insight, 8, 23–38. Retrieved from https://bit.ly/2yU3xqY
Steenkamp, J.-B. E., & Baumgartner, H. (1998). Assessing measurement invariance in cross-national consumer research. Journal of Consumer Research, 25, 78–90. https://doi.org/d7rr8k
Vallerand, R. J., & Bissonnette, R. (1992). Intrinsic, extrinsic, and amotivational styles as predictors of behavior: A prospective study. Journal of Personality, 60, 599–620. https://doi.org/bs4mrr
Xu, C., Yang, Y., Jin, S., Qu, Z., & Hou, L. (2016). Potential risk and its influencing factors for separated bicycle paths. Accident Analysis & Prevention, 87, 59–67. https://doi.org/f77c9q
Yu, J.-P., & Kim, J.-H. (2017). A review of multiple-group analysis in business research [In Korean]. Journal of Product Research, 35, 113–122. Retrieved from https://bit.ly/2OjRxp0
Figure 1. Proposed model.
Table 1. Demographic Characteristics of Respondents
Note. N = 714.
Table 2. Descriptive Statistics for Variables
Table 3. Internal Consistency Reliability Results
Figure 2. Confirmatory factor analysis results. GFI = goodness-of-fit index, AGFI = adjusted goodness-of-fit index, IFI = incremental fit index, CFI = comparative fit index, RMR = root mean square residual, RMSEA = root mean square error of approximation.
Table 4. Measurement Model Resulting From Confirmatory Factor Analysis
Note. a The variance of the internal factors is to be fixed as 1.
Table 5. Correlations Among Constructs
Figure 3. Model estimates. GFI = goodness-of-fit index, AGFI = adjusted goodness-of-fit index, IFI = incremental fit index, CFI = comparative fit index, RMR = root mean square residual, RMSEA = root mean square error of approximation.
Table 6. Standardized Structural Estimates
Note. * p < .05, ** p < .01.
Table 7. Conceptual Multigroup Analysis Results
Table 8. Measurement Equivalence Test Results
Note. CFI = comparative fit index, RMSEA = root mean square error of approximation.
Table 9. Exploratory Factor Analysis Results
Figure 4. Modified confirmatory factor analysis results. GFI = goodness-of-fit index, AGFI = adjusted goodness-of-fit index, IFI = incremental fit index, CFI = comparative fit index, RMR = root mean square residual, RMSEA = root mean square error of approximation.
Figure 5. Modified model estimates. GFI = goodness-of-fit index, AGFI = adjusted goodness-of-fit index, IFI = incremental fit index, CFI = comparative fit index, RMR = root mean square residual, RMSEA = root mean square error of approximation.
Table 10. The Modified Conceptual Model for the Korean Group
Note. ** p < .01.